How to Correctly Use the Lightroom Histogram
The Lightroom histogram is a crucial tool in digital photo editing. Today, we will guide you through everything you need to know about the Lightroom histogram. These skills are transferable as almost every digital editing software will include a histogram.
Our ultimate guide will show you how to use the Lightroom histogram correctly. We will cover everything from reading the histogram to using it for edits. Every photographer should understand how this graph works, so read on to find out more.
What Is A Histogram?
A histogram is a graph that shows us the tonal values of a photograph. By reading a histogram, you can tell if a photo is too bright, dark, flat, or contrasty. It is a helpful way to show us how to start our photo editing process.
Modern histograms in digital editing software sometimes also show different color channels. Knowing these color channels is useful for color-correcting and color-casting photos.
A histogram is also a great way to check if your screen is good for photo editing. If the histogram looks good, and your screen looks too dark, you better not edit on that screen. Editing on a bad screen will heavily affect how your image looks on other screens or printed out.
 © Maxim Medvedev
Histogram in Lightroom vs. Lightroom Classic
Adobe Lightroom now comes in two different versions: Lightroom and Lightroom Classic. Both versions have many of the same functions; what differs are the approaches to editing processes.
Lightroom favors a post-processing workflow that utilizes the cloud. This allows you to work from the same set of images on any device you want. This version also prioritizes simplicity and ease of use through a stripped-back interface. This may be easier for beginners to work through.
Lightroom Classic has an interface with which any photographer who has used the past versions of Lightroom would be familiar. It provides a wide range of features, some of which you may never need to use. You will find more in-depth controls and attention to detail in Lightroom Classic.
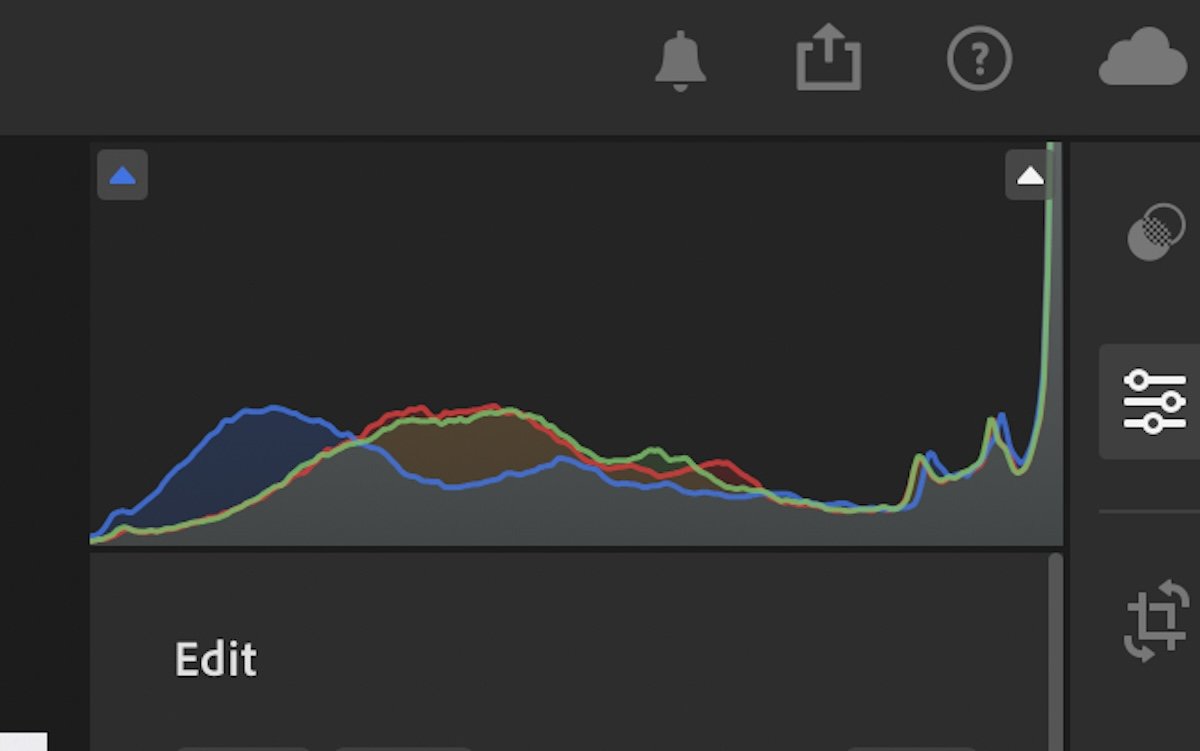
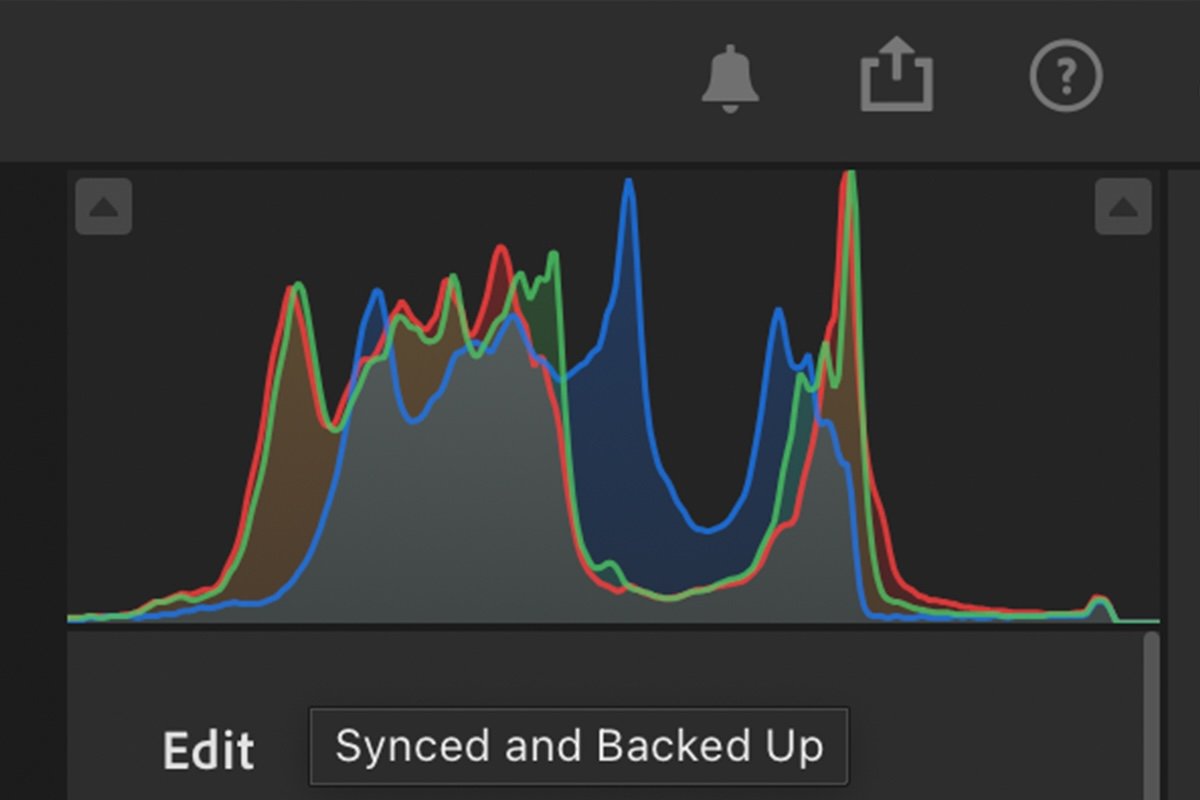
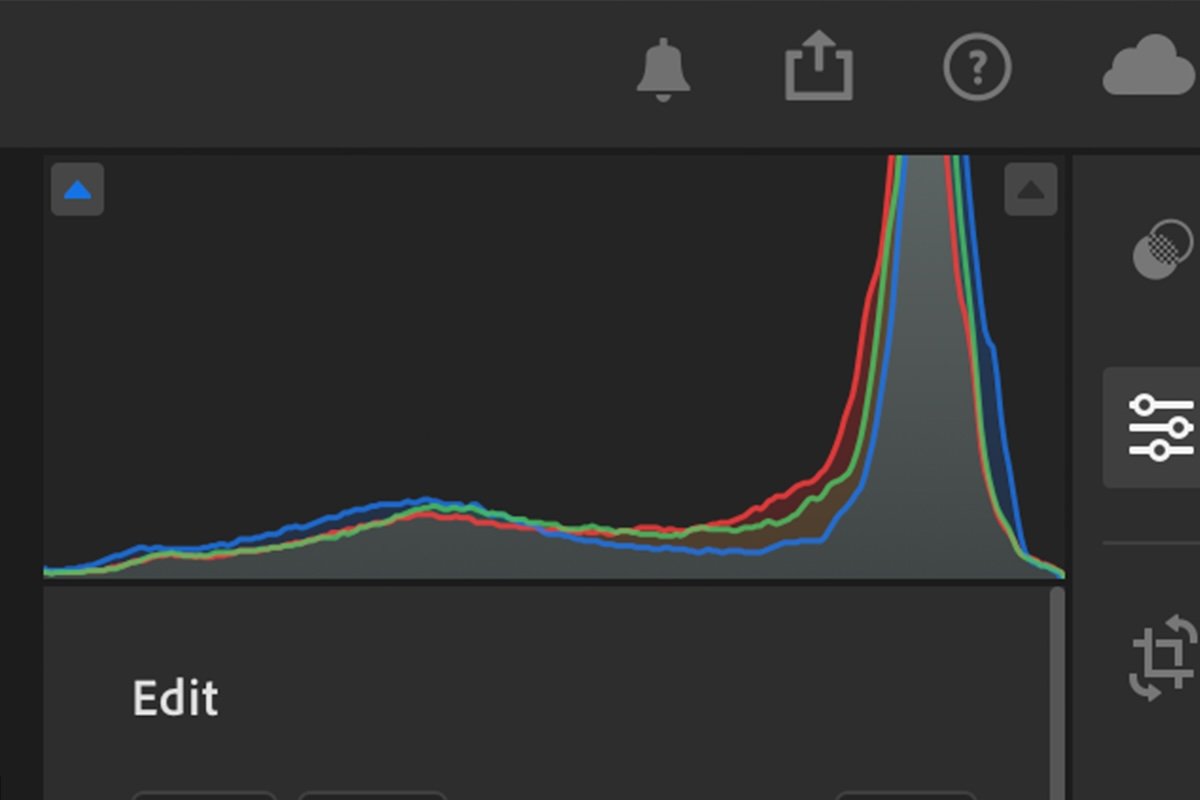
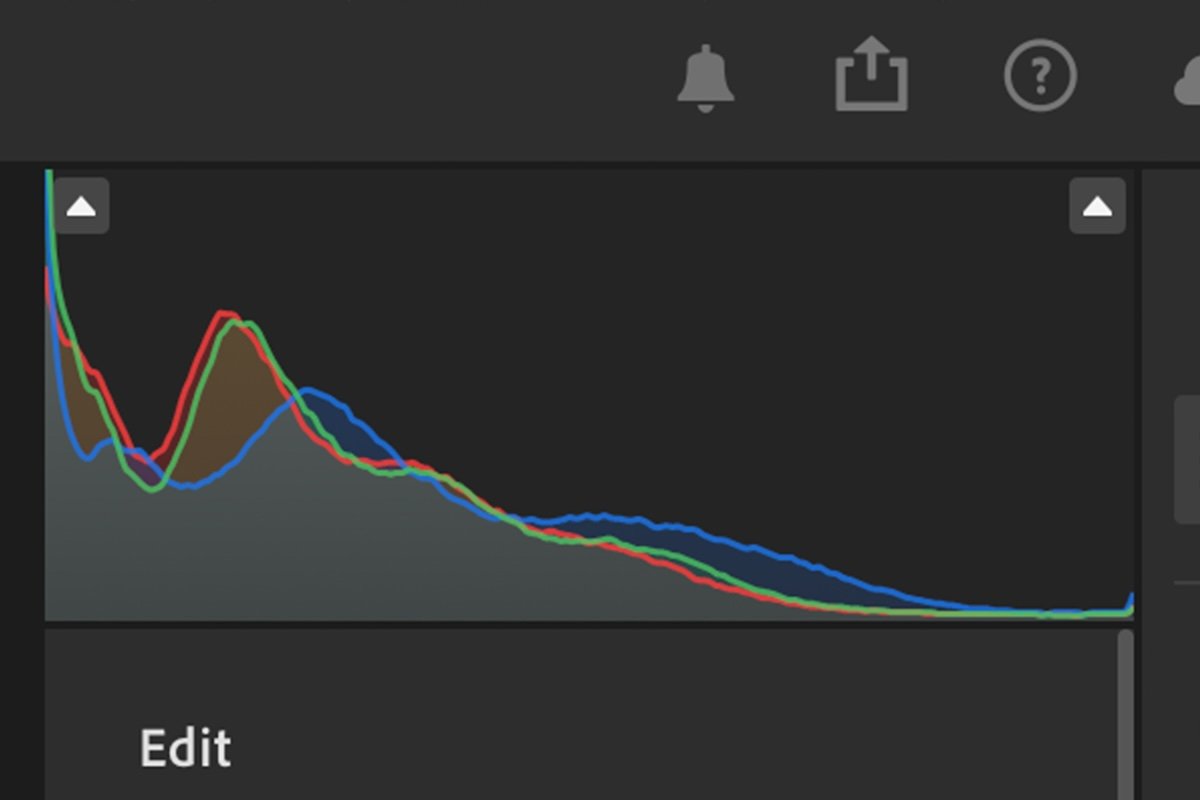
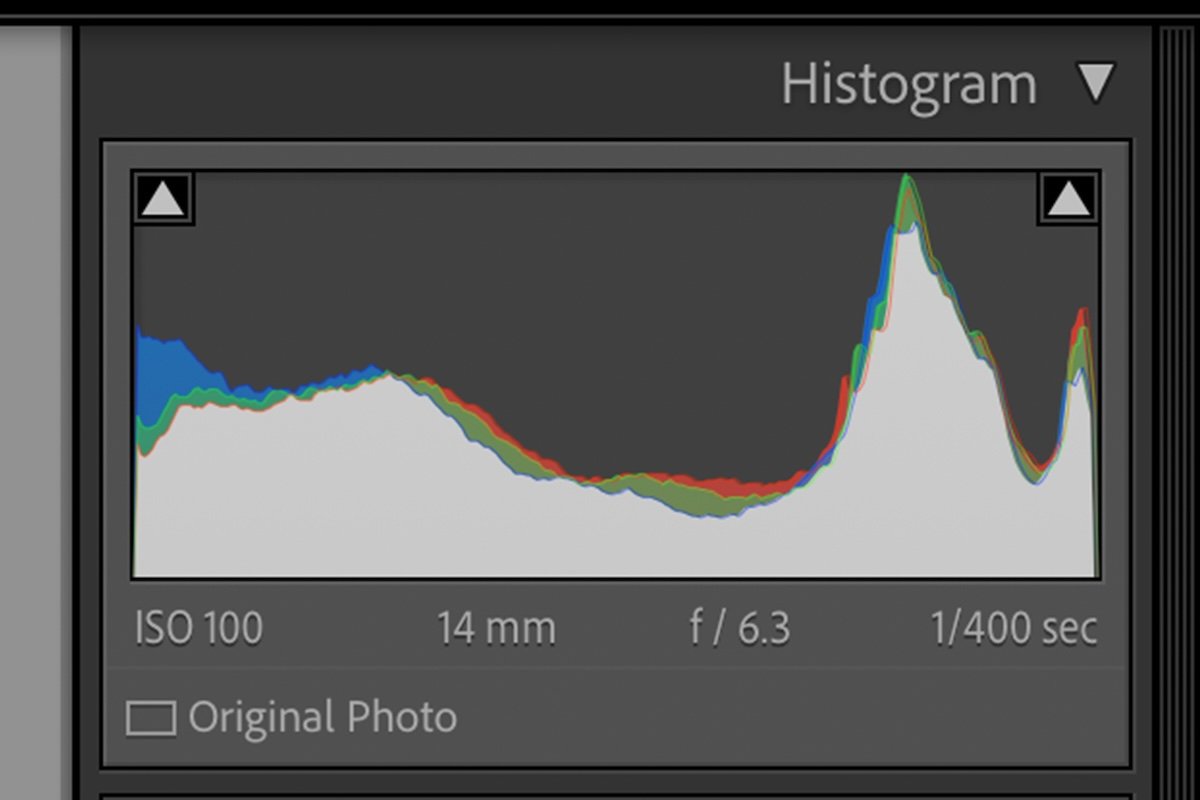
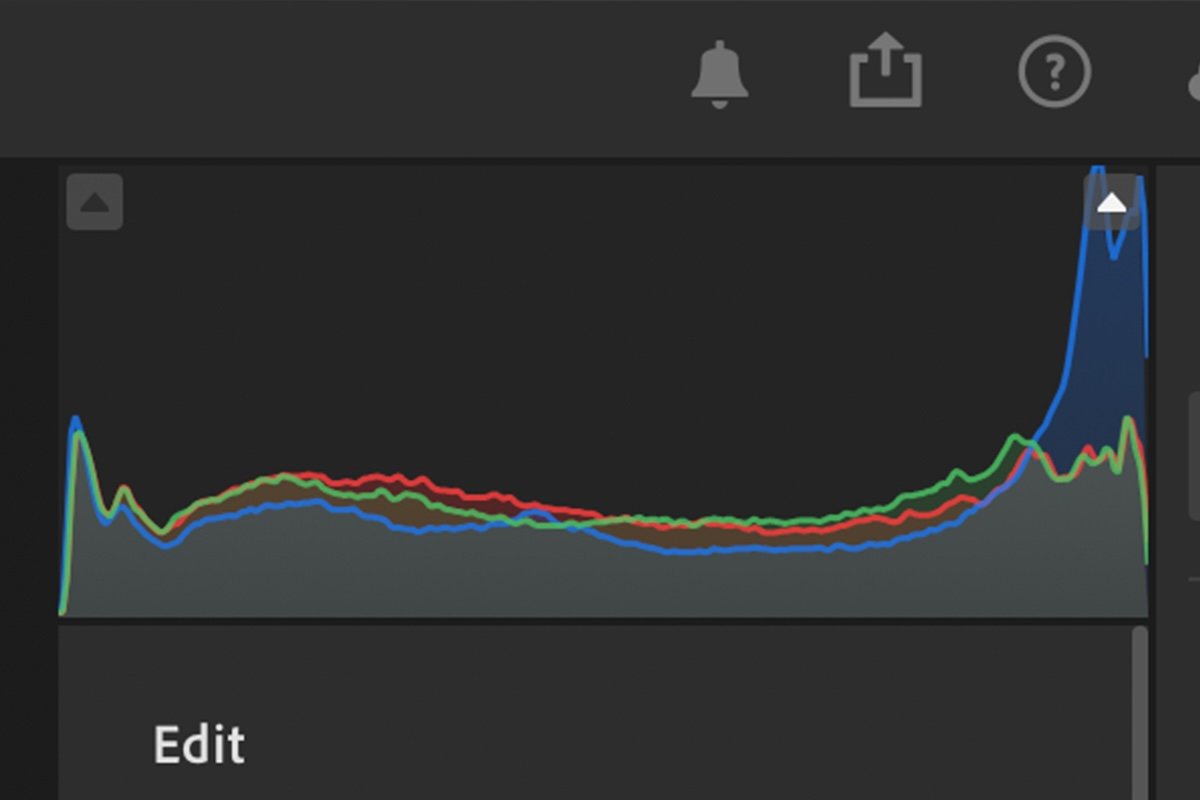
The two programs use different approaches to the histogram visually. Lightroom’s histogram is more slick and simple, whereas Lightroom Classic’s is more visually detailed. The major difference between the two histograms is that Lightroom doesn’t allow you to edit the photograph directly through the histogram.
How To Read A Histogram
A histogram is almost impossible to read if you haven’t been introduced to this graph before. But it is easy to decipher once you understand how it works.
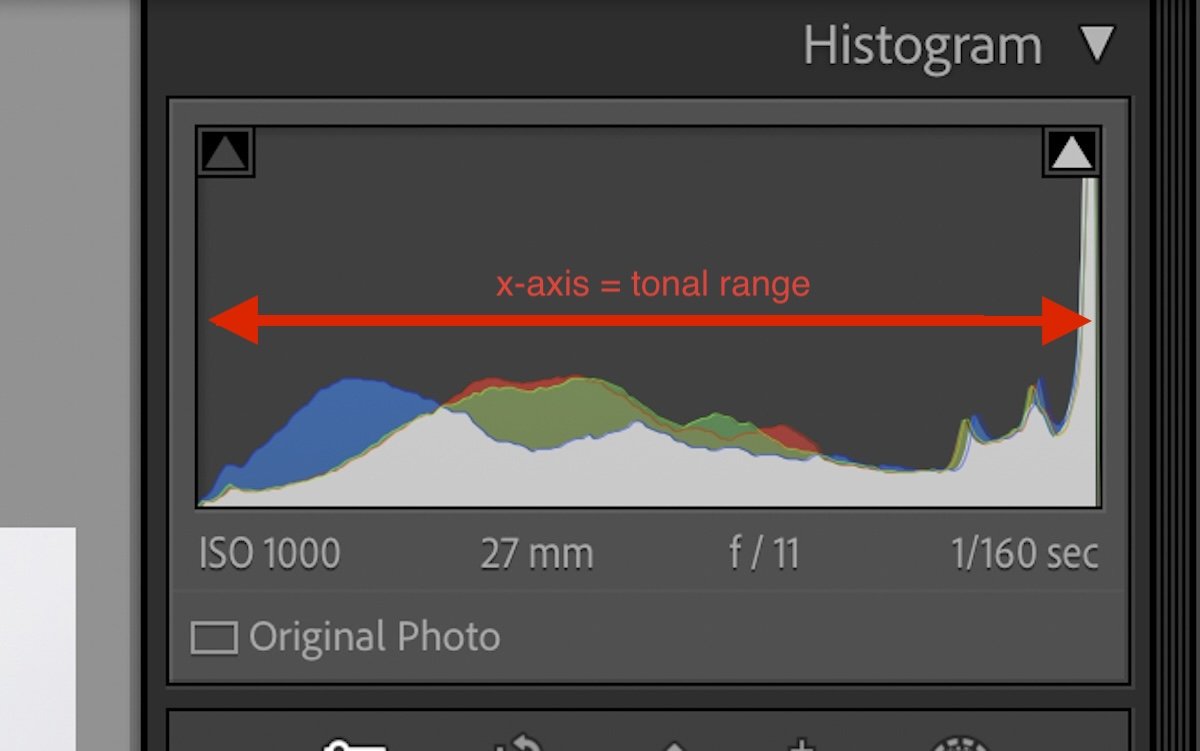
The x-axis (from left to right) represents the tonal range possible in a photograph. The left of the histogram represents the blacks, and the right represents the highlights. So, the histogram x-axis represents a gradient from true black to true white.
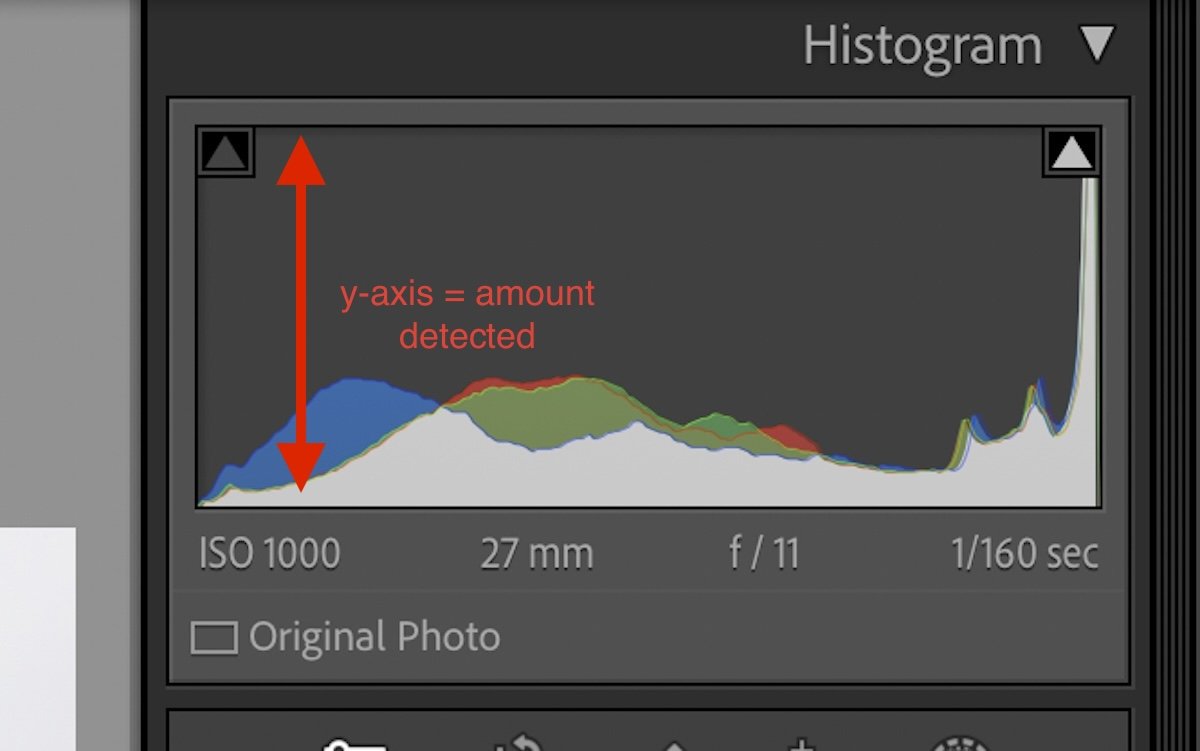
The y-axis (from top to bottom) represents how much of the specific tonal value is in the photograph. So, the higher the marking on the graph, the more this tonal value is dominant in your photograph.
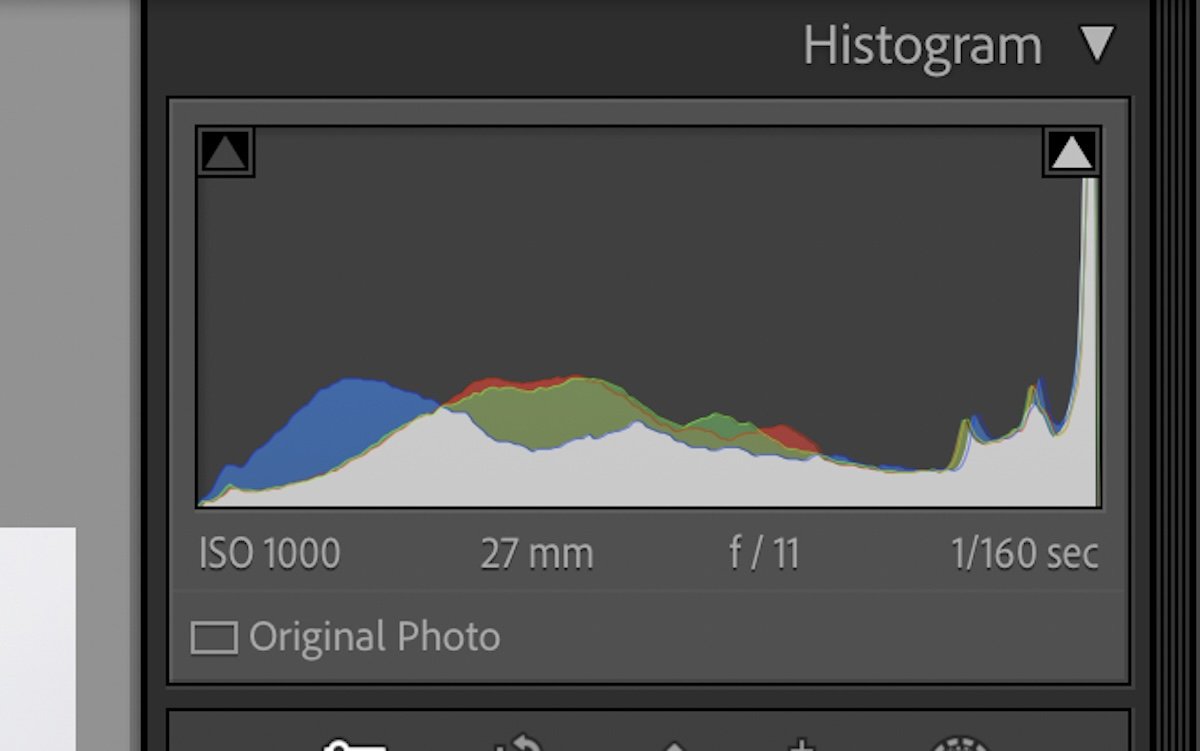
The Lightroom histograms also include color channels. These are individual areas for the RGB (Red, Green, Blue) channels. Like the tone, these areas will show you how much of each channel is in which tonal area.
Understanding A Photograph Through A Histogram
The histogram can tell you a lot about your image without even seeing your photograph. We will now introduce how you can identify your photographs using the histogram.
Every photograph will be different. Stylistic choices will impact what is deemed a ‘good distribution of tones.’ Therefore, there is no set histogram to aim towards.
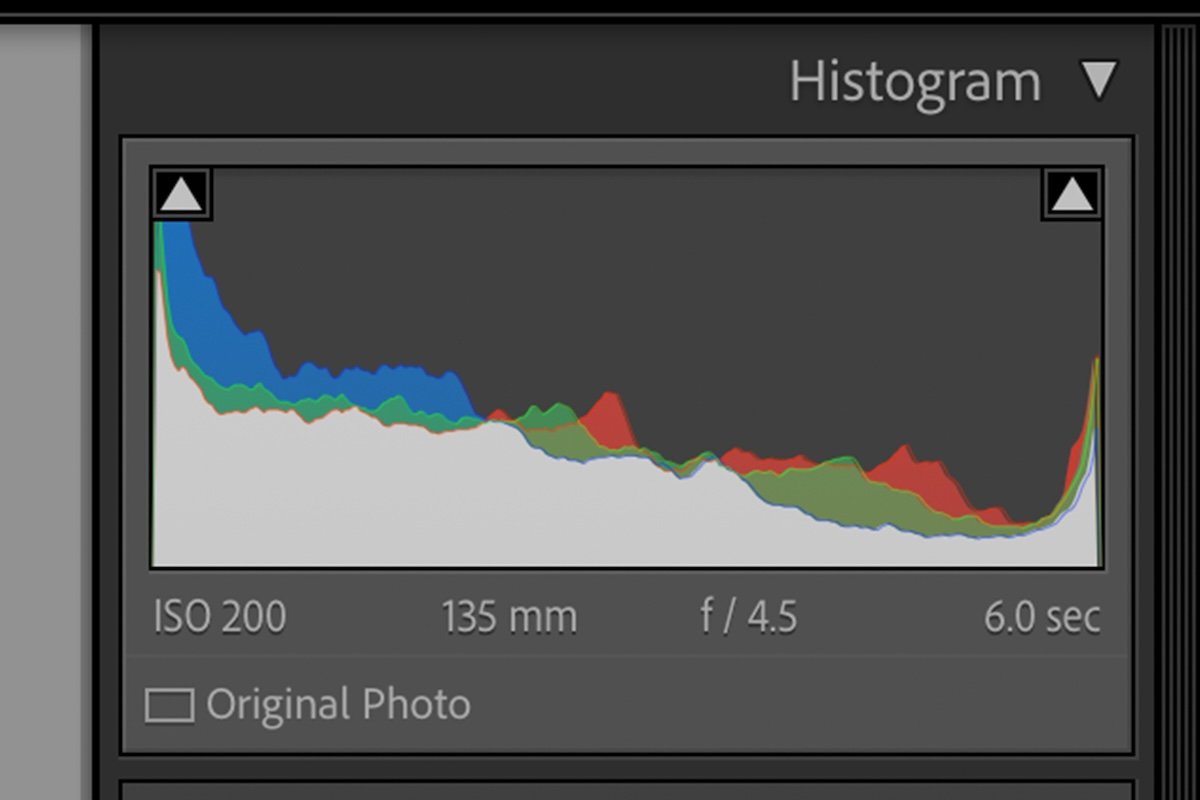
The x-axis of the histogram represents the tonal range, so photographers usually look for an even spread across this axis.
One point that photographers do not want is for the graph to bunch up, directly touching the right or left of the graph. This means that many of the tones are lost to over or underexposure.
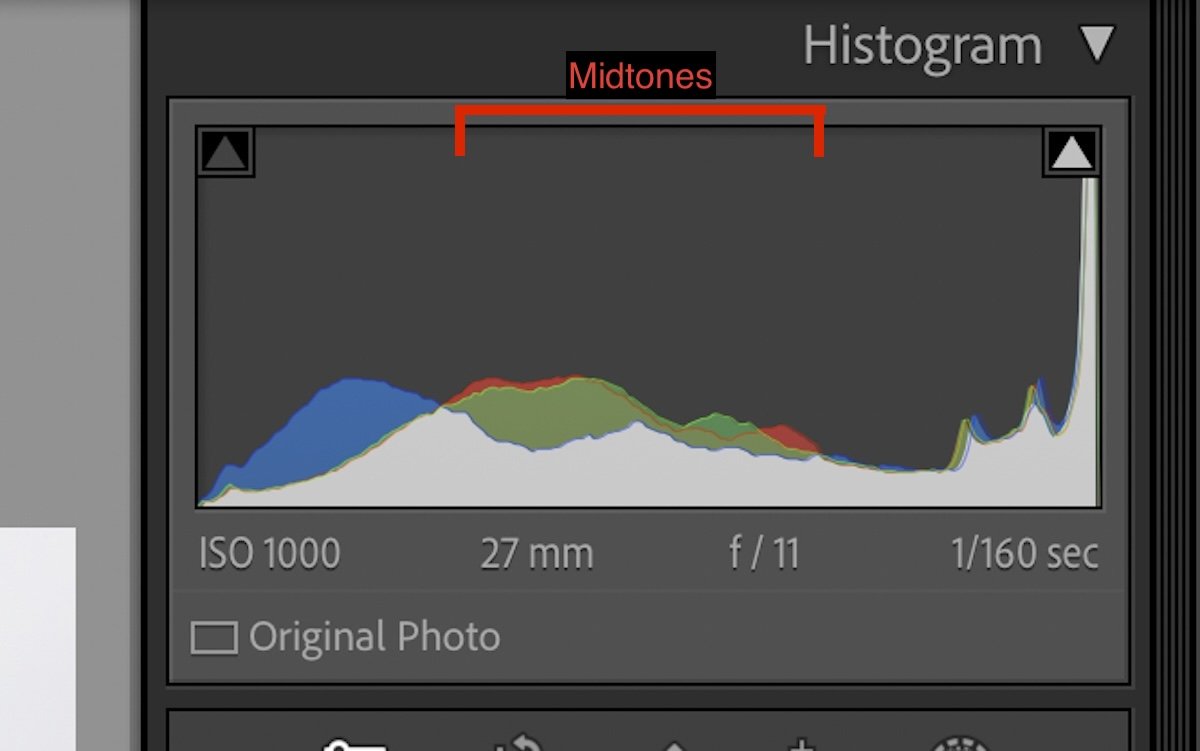
On the other hand, if the data does not extend close to the edges of the histogram, your photograph may be flat. A flat histogram will house all the data in the midtone section of the graph. These images will have a low contrast.
Photos with histograms leaning toward the left will contain mostly dark tones. Histograms with data to the right will contain mostly light tones.
If there are points at both ends of the graph, the photo will have a high contrast. The closer to the edges, the closer the tones will be to being washed or blacked out.
Many photographers will say that you may want a histogram that looks like a camel’s hump. This hump means there is plenty of data in the shadows and highlights, not too many midtones, and few full blacks or whites.


Examples of Photographs and Their Histograms
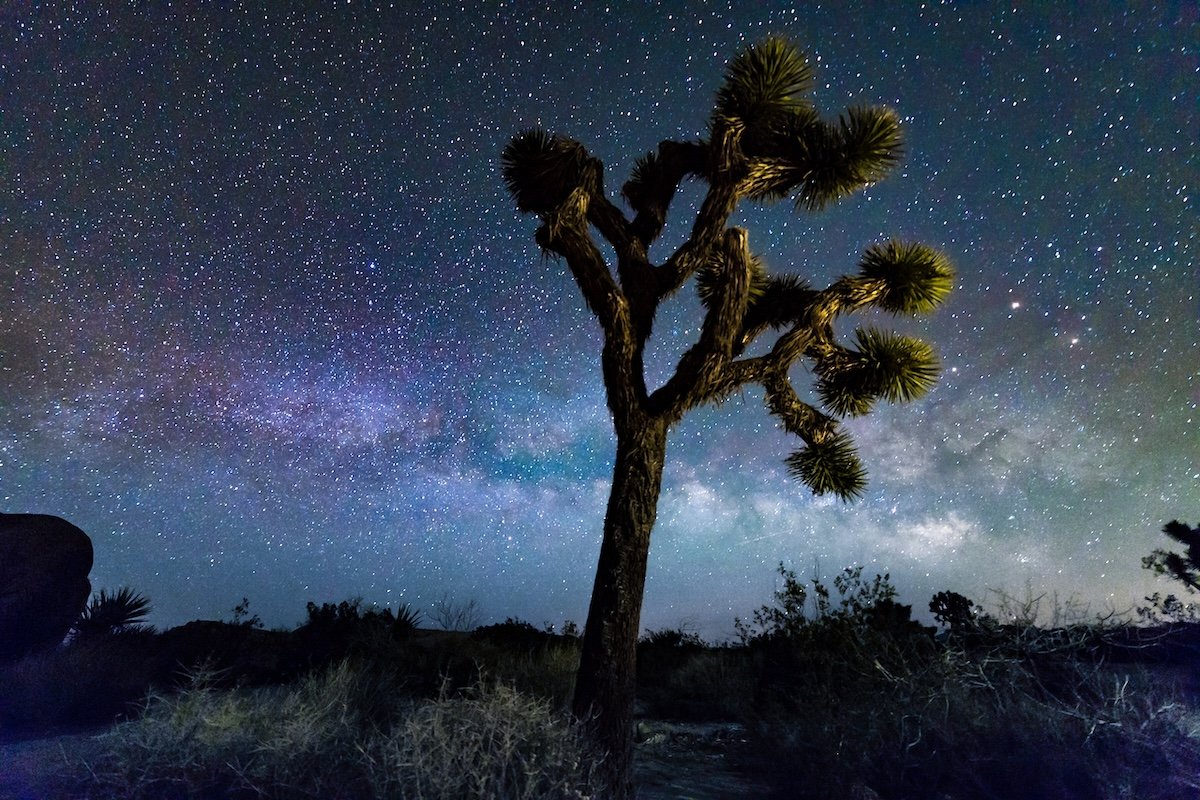
Now, we will present a range of histograms and their matching photos. Before revealing the photograph, see if you can figure out what it could look like.


Aspects To Consider That May Change A Histogram
Let’s now discuss important factors that could change the histogram data. You must consider these points before planning how to approach your editing according to the histogram.
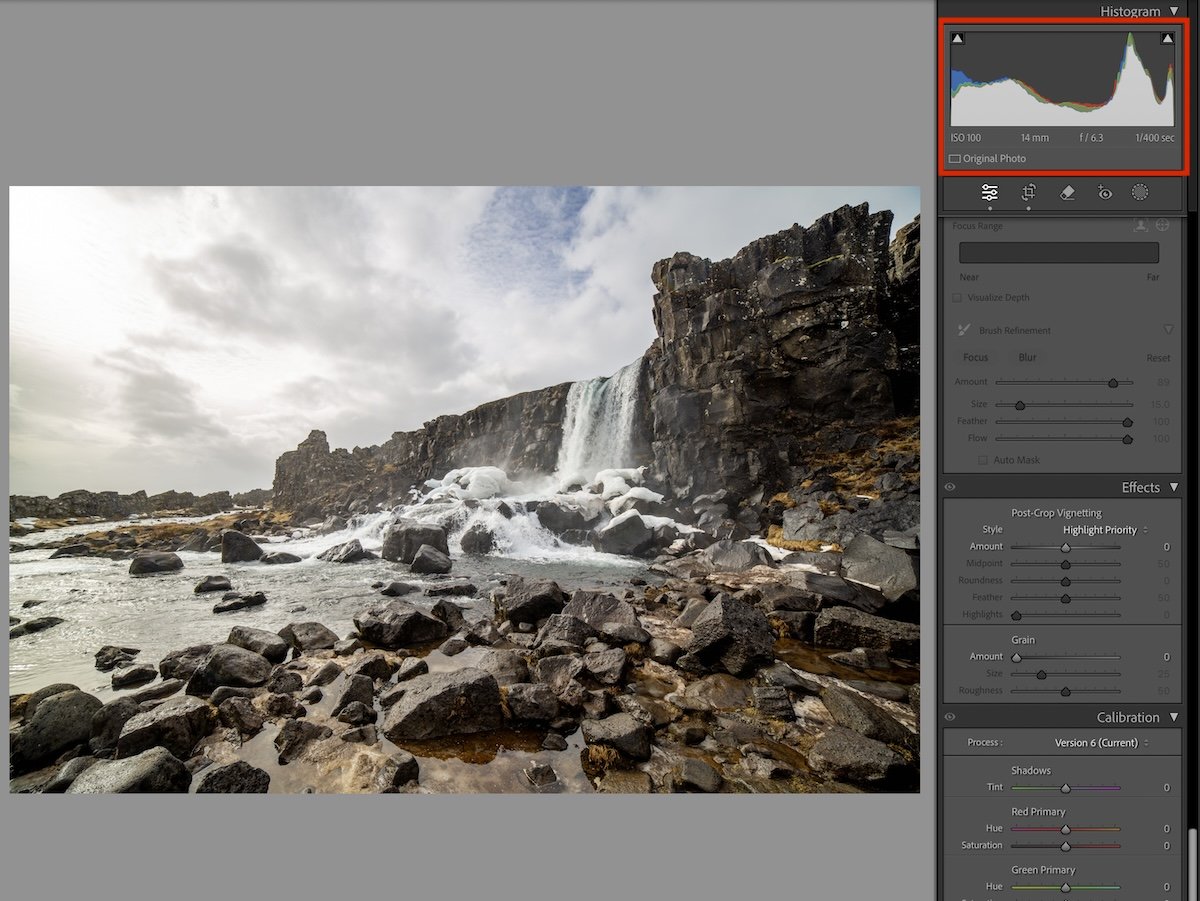
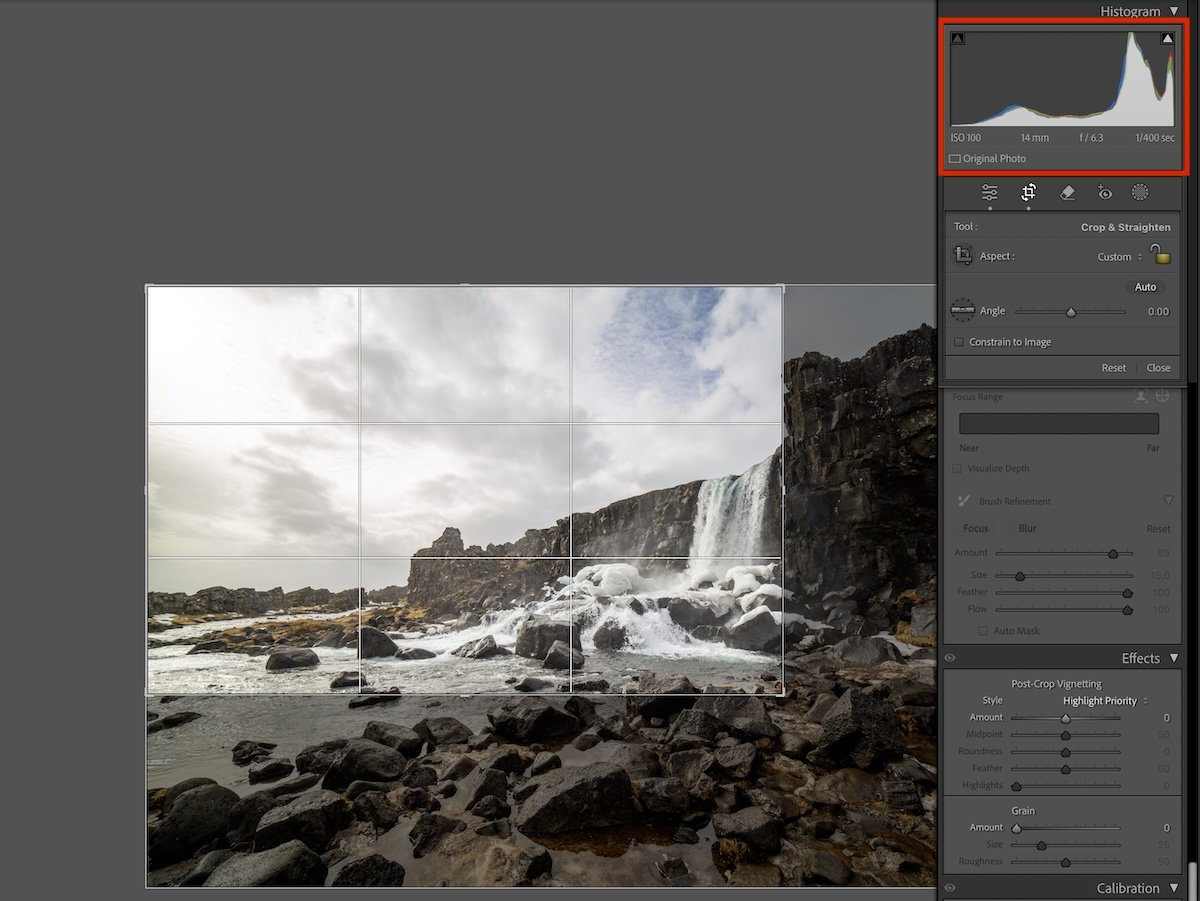
The first aspect to consider is whether you will crop your photograph. The histogram will change depending on the tones in your current selection and as you move around your crop borders. This can help select the right dynamic range in your photograph.
Color adjustments will also affect your histogram. The most important are the White Balance and Temperature/Tint adjustments. These adjustments move the color data, which then adjusts the overall data. Therefore, these sliders will affect the contrast and tonal range of your photograph.
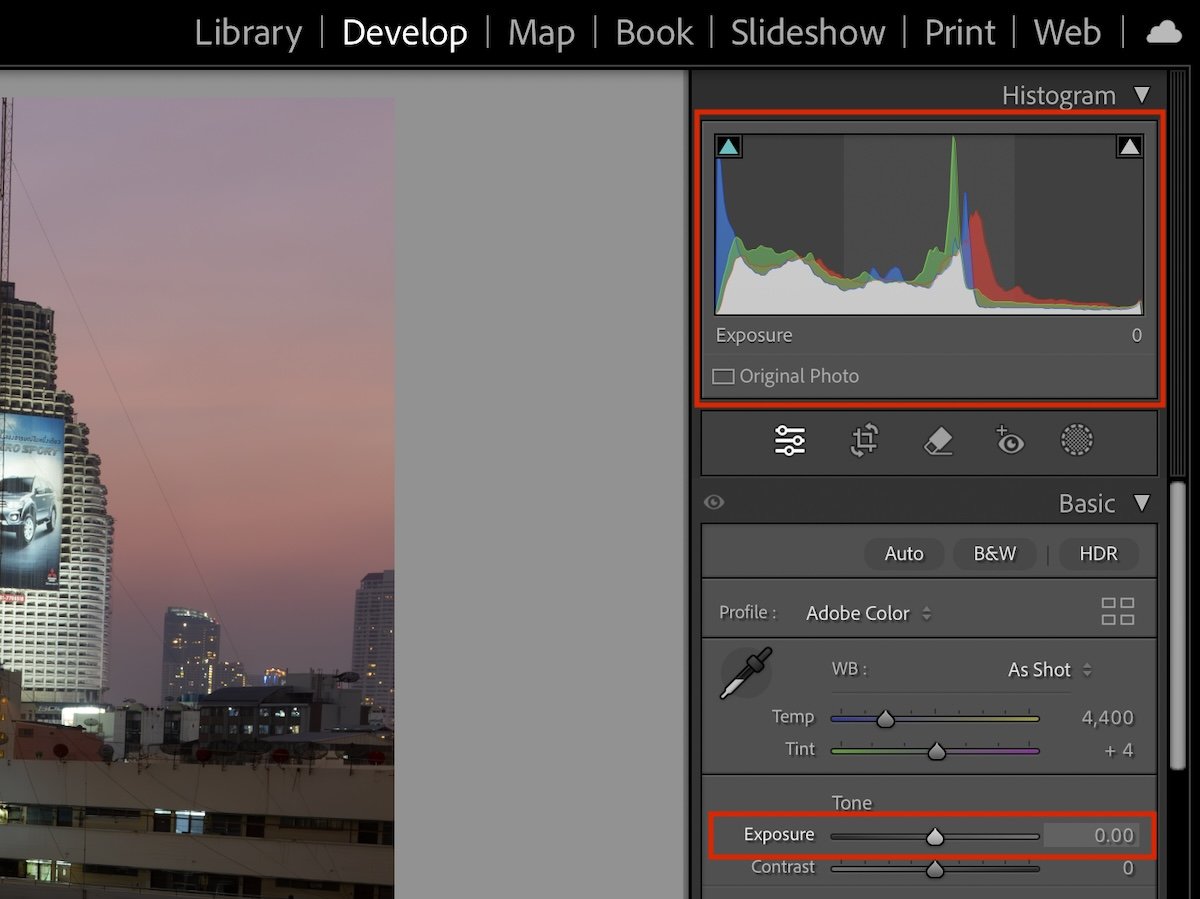
Using The Lightroom Histogram For Edits
Lightroom Classic lets you edit the corresponding sliders by clicking directly on the histogram. This feature is unique to Lightroom Classic, so you cannot use it in Lightroom.
The area will be highlighted as you hover over each histogram section. These areas will correspond to the tonal slider adjustments. The sliders will also have their numerical value highlighted when you hover over the histogram.
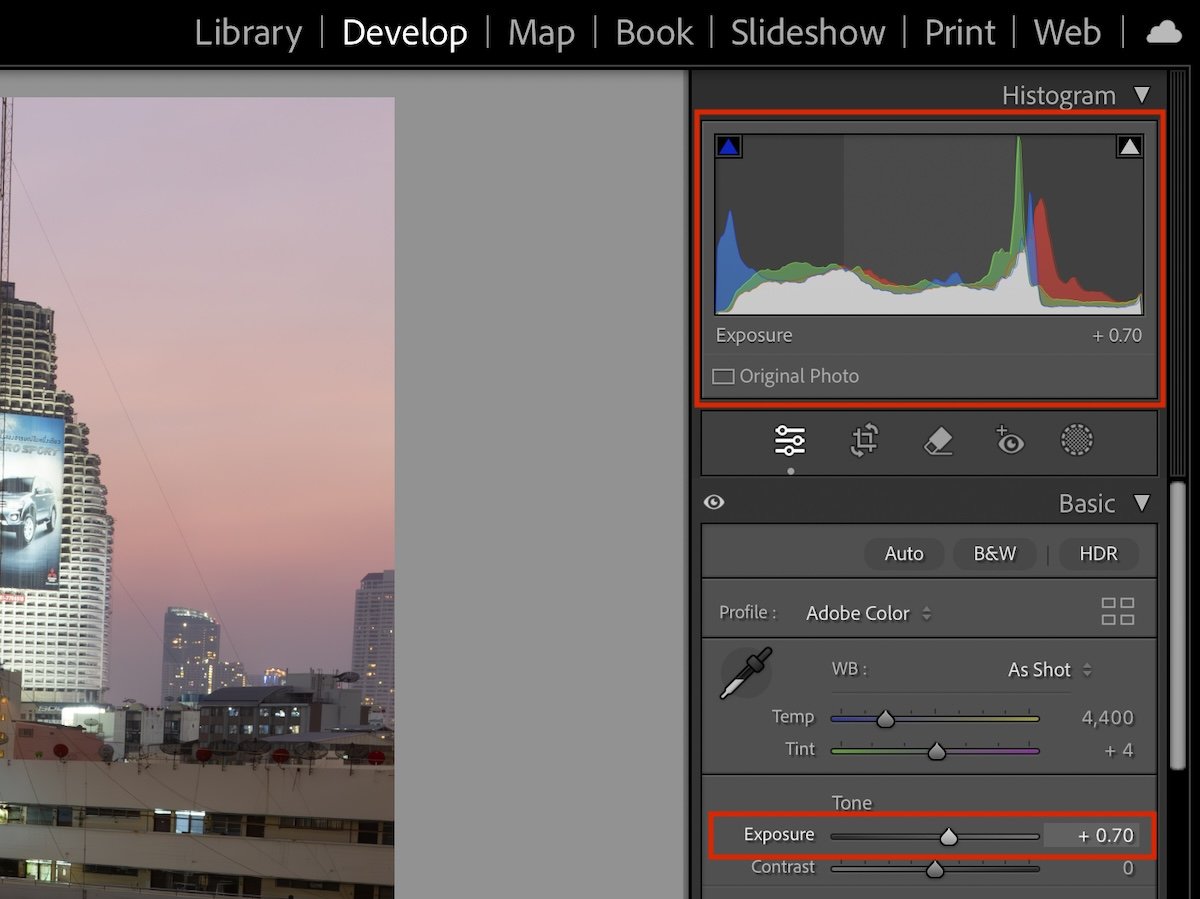
To make adjustments using the histogram, simply click and drag the mouse from left to right. Dragging your click left will decrease the amount of the adjustment to your slider, and dragging it to the right will increase it.
Playing around with this editing approach provides a great insight into how a histogram works. You can directly see how different tones affect the histogram. You can also see how the values and data changes depending on the photographs properties.
Edit Clipping With The Lightroom Histogram
Clipping is the term used for pure black or white tones. Information is ‘clipped’ as these areas can have more information in them, but due to the photo or editing, the information is cut short.
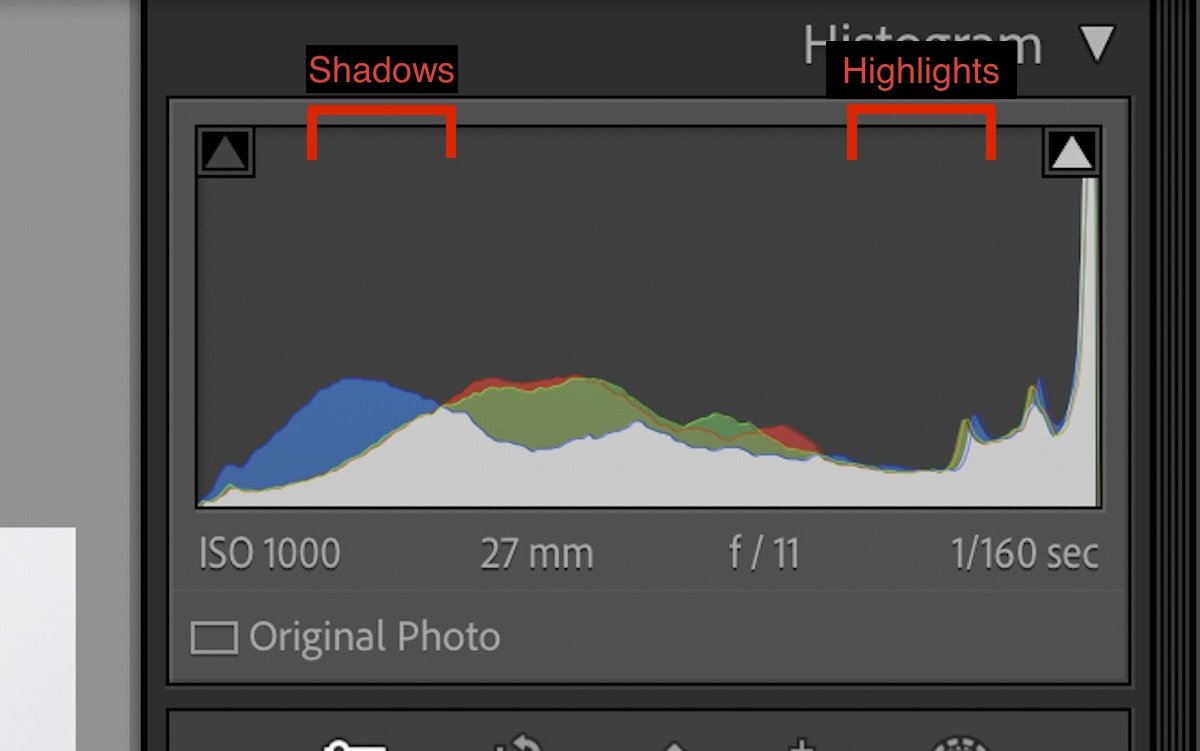
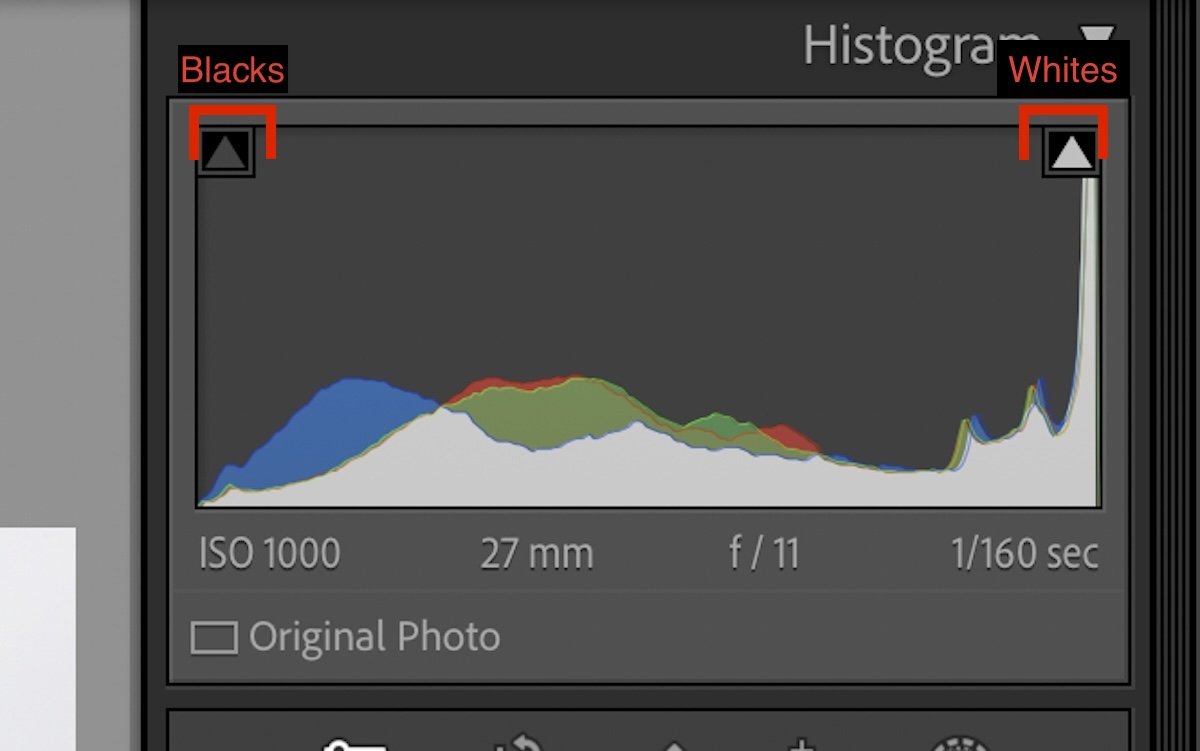
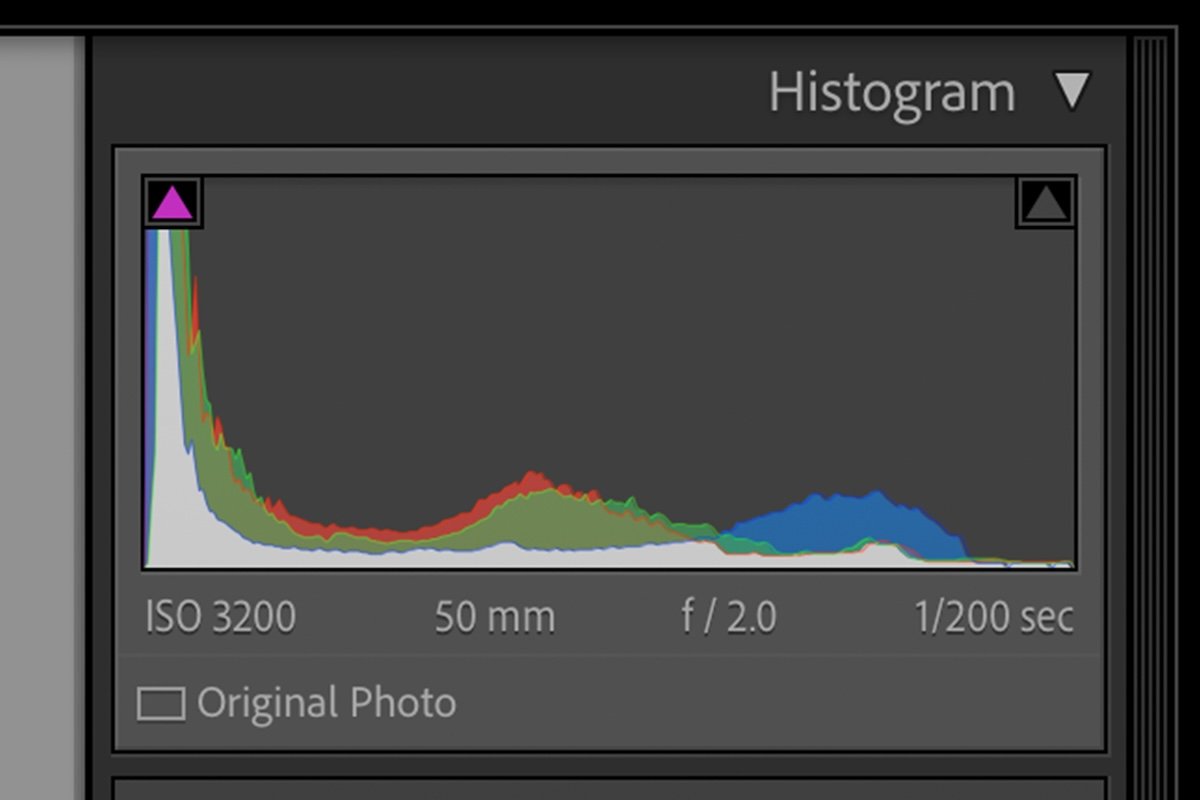
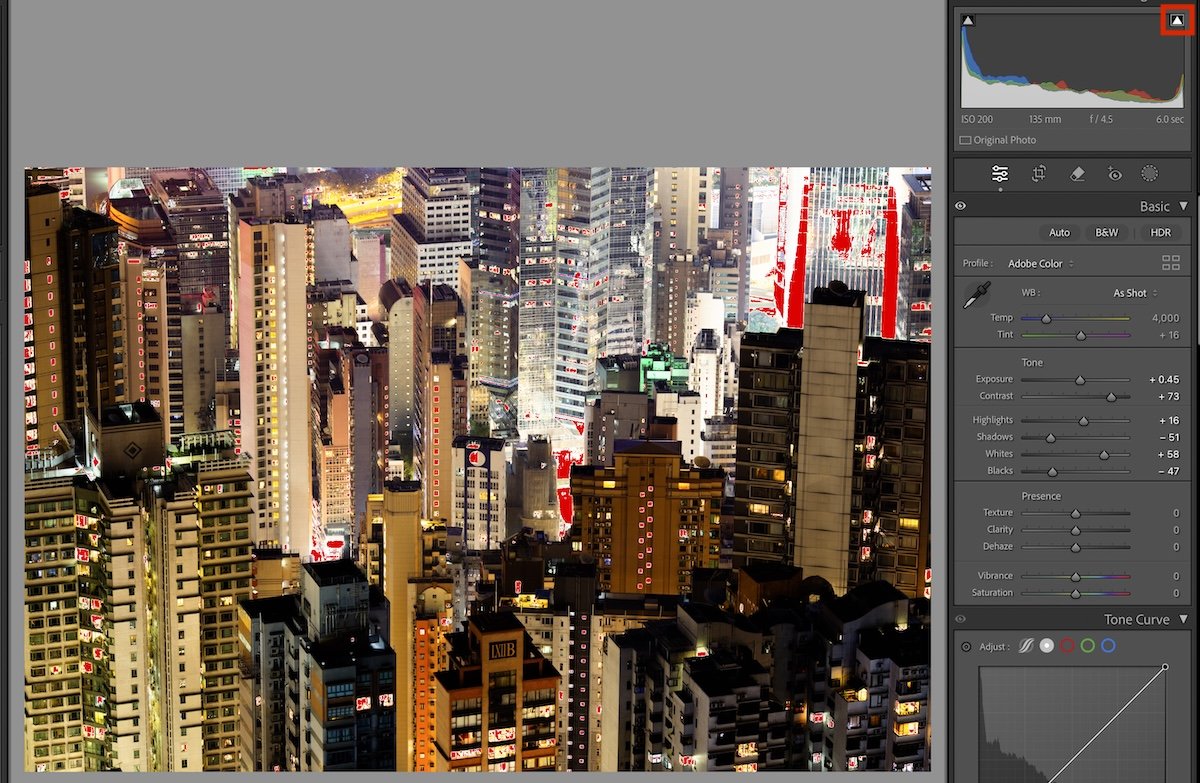
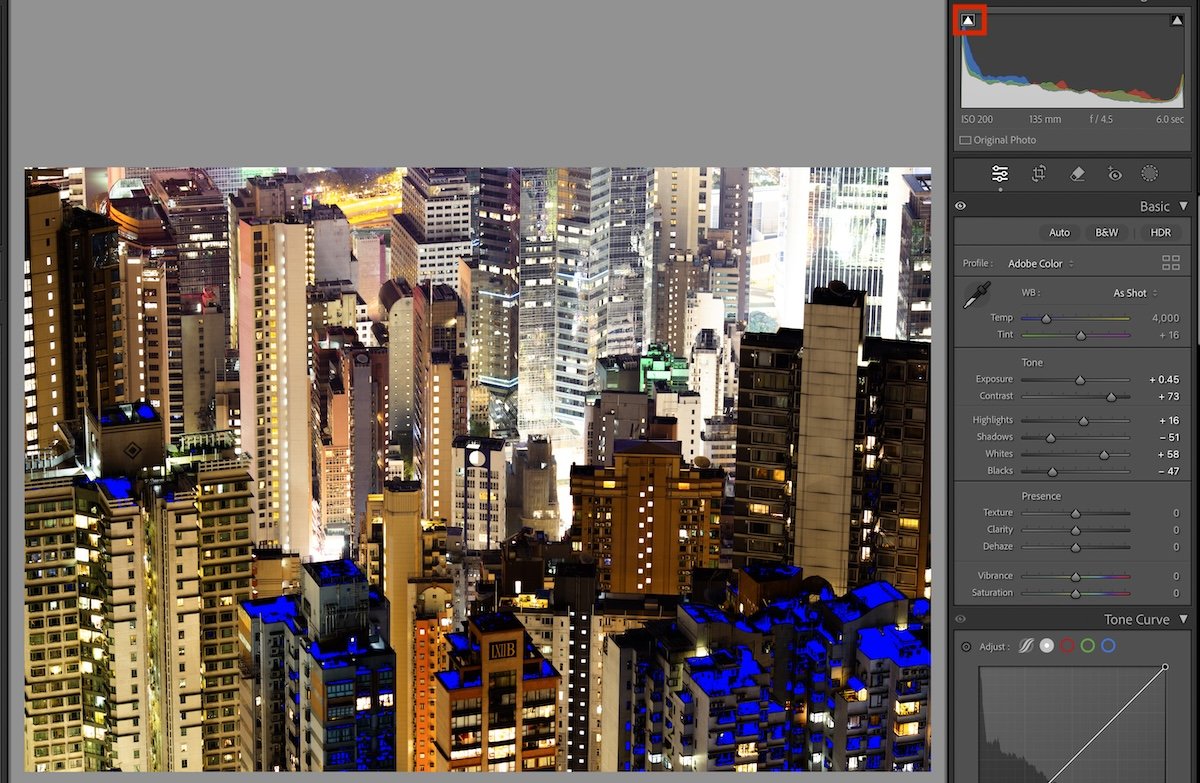
The Lightroom histogram provides a quick and easy way to show these ‘clipped’ areas. You can highlight these areas by finding the triangles on the top right and left of the histogram. The left will show the Blacks, and the right will show the Whites.
If the triangle is highlighted, you can tell if your photo has clipped areas. When you hover over the triangle, the areas will appear in your photograph. The white areas will turn red if you are on the overexposed triangle. The black areas will appear blue if you are on the underexposed triangle.
Lightroom allows you to leave these areas highlighted if you click the relevant triangle. This allows you to make adjustments to reduce these areas while seeing your direct impact.
Showing the clipped areas is a brilliant feature that most digital editing software will have. This is because it helps us put as much information into the image as possible. Even if it is hardly noticeable, a little information is always much better than pure whites or blacks.
Conclusion: Lightroom Histogram
After an introduction to the Adobe Lightroom histogram, we can see how important this tool is. It is no surprise that most digital editing software includes this graph. Most digital cameras will also have a histogram and even a live histogram.
Histograms are everywhere in photography, so getting familiar with them early is worth it. Once you have learned the basics we outline here, it is an easy graph to read. Return to this article if you need help with your Lightroom histogram.
About the author

By accepting you will be accessing a service provided by a third-party external to https://kendallcameraclub.org/